Join WhatsApp Group
Join NowWhat Is the Morning Star Candlestick Pattern?
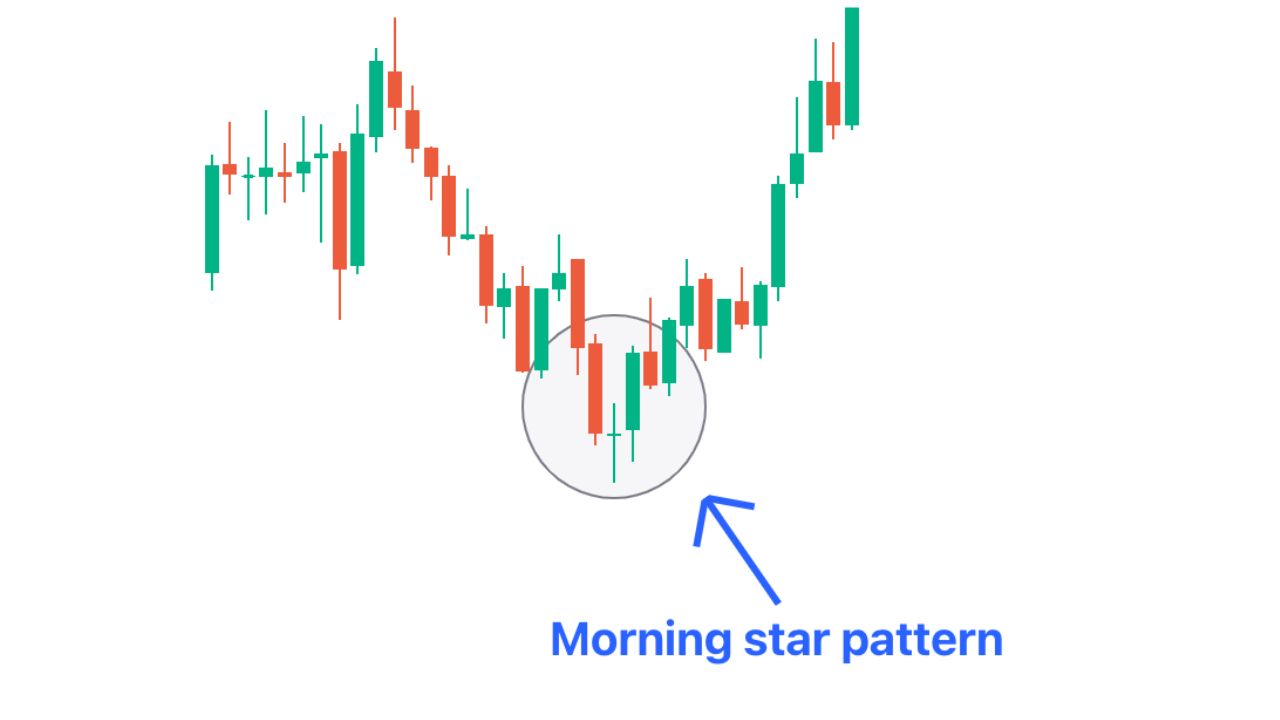
The Morning Star Candlestick Pattern is a bullish reversal pattern in technical analysis. It appears after a downtrend and suggests a possible shift from sellers being in control to buyers taking over.
In simple terms: when the market has been going down, and you spot this pattern of three candles, it may signal that the down-trend is ending and an up-trend might begin.
Psychology Behind the Pattern — Why It Signals Trend Reversal
- The first candle is long and bearish: it shows sellers dominating and pushing the price down.
- The second candle is small (maybe a doji or small body): it reflects indecision — sellers may be tired, buyers may be stepping in.
- The third candle is strong and bullish: it shows buyers gaining strength and turning the momentum around.
Together, these reflect a shift in market sentiment from bearish to bullish.
Where Morning Star Appears in a Downtrend
For the pattern to be meaningful, it typically appears after a downtrend (i.e., prices falling over some time). That’s because it works as a signal of reversal — if there was no preceding decline, the reversal message is weaker.
Also worth noting: the stronger the downtrend before the pattern, the more meaningful the reversal signal could become.
Table of Contents
Components of a Morning Star Pattern
Candle 1 — Long Bearish Candle
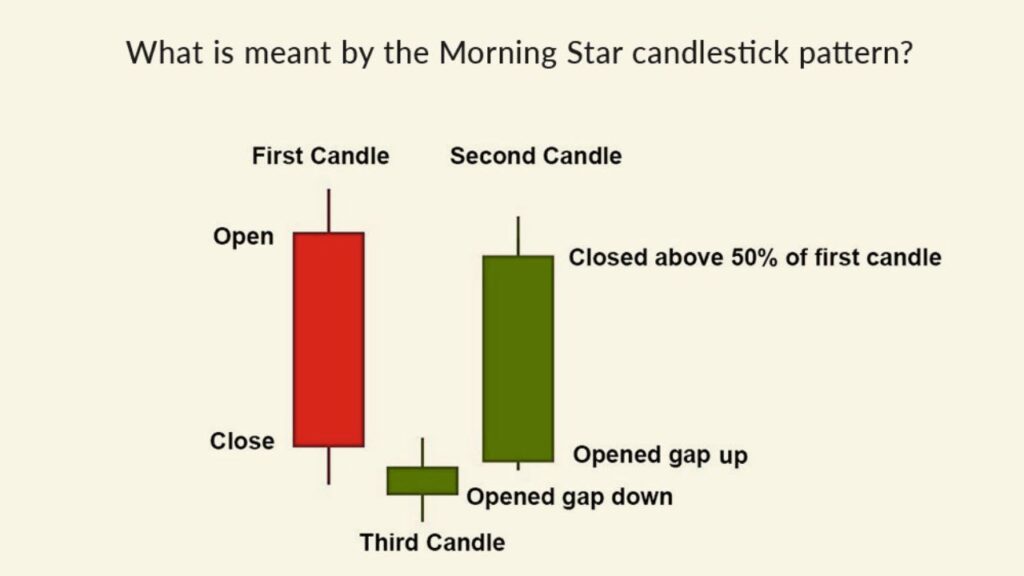
- This is the first candle in the sequence. Prices open, then sellers push them down significantly, closing well below the open.
- It shows the prevailing bearish momentum is still strong.
Candle 2 — Small Indecision / Doji Candle
- The second candle has a small real body (could be either colour) and may gap downward or open lower than the previous close.
- It signals hesitation in the market – the bears might be losing steam, buyers are testing the waters.
Candle 3 — Strong Bullish Candle
- The third and final candle is a long bullish candle. Ideally it closes well into the body of the first candle – showing buyers have taken control.
- This candle confirms the reversal from downtrend to uptrend.
How to Identify the Morning Star Pattern (Step-by-Step)
Confirming features
- Ensure there is a clear prior downtrend.
- First candle: strong bearish body.
- Second candle: small body (could be doji) and ideally gaps down.
- Third candle: strong bullish body that closes into or beyond the midpoint of the first candle’s body.
- Volume (if available) increasing on the third candle adds strength.
- The pattern appears at or near support zones or other reversal areas for higher probability.
Timeframes where Morning Star works best (Day, 4H, Weekly)
- The pattern can form on multiple timeframes (daily, 4-hour, weekly).
- On higher timeframes (daily and weekly), the reversal signal tends to be stronger because the move is more significant.
- On lower timeframes (e.g., 1-hour), the pattern can still work but may carry more noise and false signals — extra caution required.
- In practice, many traders prefer daily or 4H charts for higher reliability.
How to Trade the Morning Star Candlestick Pattern
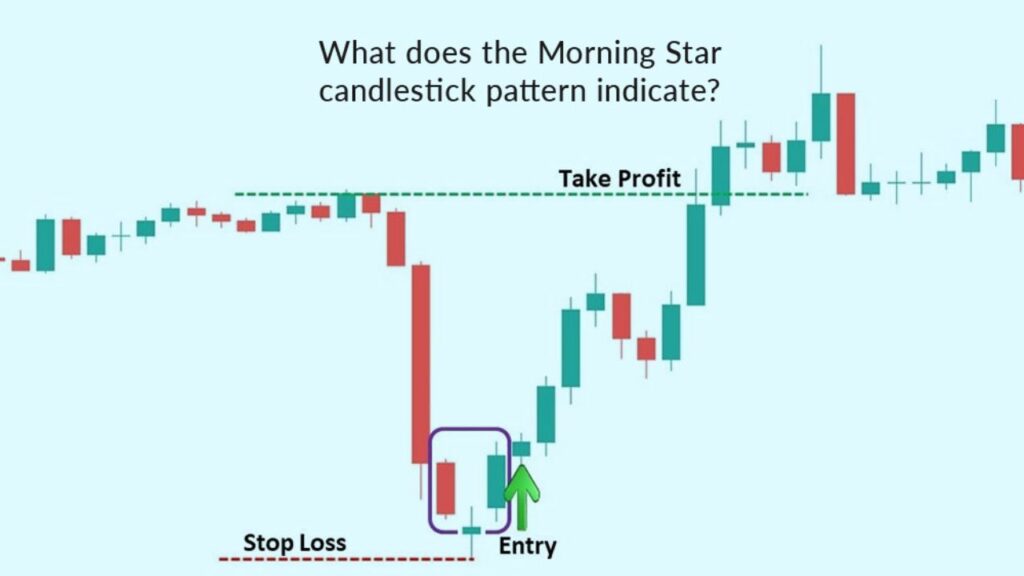
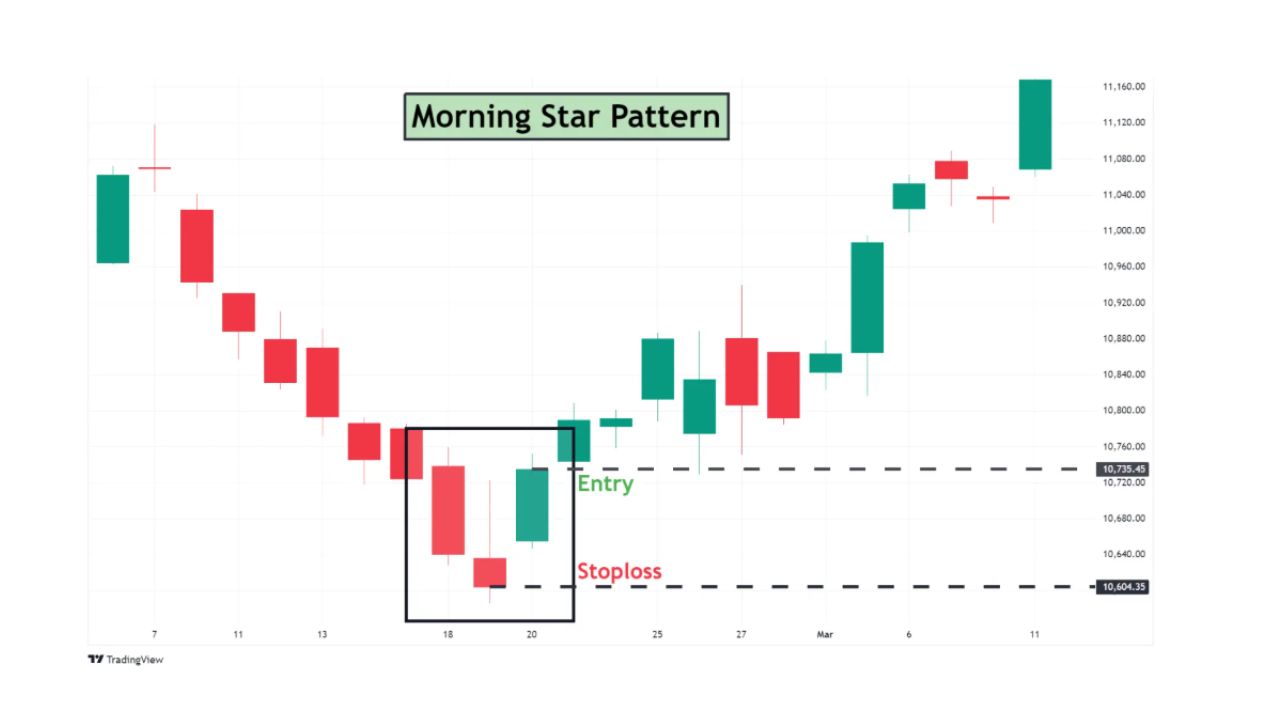
Entry Signals (Confirmation Candle Rules)
- Wait for the third candle (the bullish one) to close. Entry can be taken once that close confirms the pattern.
- Some traders wait for a further confirmation (e.g., price moves above the high of the third candle) to reduce risk of false signal.
- It’s best if the third candle closes significantly into the first candle’s body (e.g., more than halfway). This strengthens the signal.
Stop-Loss and Risk Management
- Place a stop-loss below the low of the second candle (or below the low of the entire 3-candle pattern) to manage risk.
- Keep risk/reward in mind: because the pattern signals a reversal, you ideally want a reward that is multiple times your risk.
- Adjust position size accordingly so that a stop-loss hit doesn’t blow your account.
Best Profit Targets & Exit Strategy
- One common target is the most recent swing high (before the downtrend turned).
- You may also use a multiple of the risk: e.g., risk-to-reward at least 1:2 or 1:3.
- Another target strategy is using Fibonacci extensions (for example 161.8% extension) from the pattern’s range.
- It’s wise to trail the stop-loss once the trend is underway, to lock in profits while allowing for further move.
Morning Star + Indicators Strategy for Higher Accuracy
With RSI
- When the pattern forms and the Relative Strength Index (RSI) is showing an oversold condition (for example RSI < 30), this can add strength to the setup.
- After entry, you can monitor RSI to see if momentum continues (e.g., RSI rising above 50) as extra confirmation.
With Moving Averages
- Presence of a pattern near or above a key moving average (e.g., 50-day or 200-day) can increase confidence.
- If price closes above the moving average after the third candle, it might signal a stronger trend reversal.
With Volume Analysis
- A spike in volume on the third bullish candle often indicates that buyers are confidently stepping in.
- Low volume may weaken the signal, so be cautious if the third candle is strong but volume weak.
Common Mistakes Traders Make (and How to Avoid Them)
- Entering too early, before the third candle closes.
- Ignoring the need for a prior clear downtrend or good context.
- Using the pattern in isolation without confirmation (volume, indicators, support zones).
- Placing stops too far away or not using stop-loss at all.
- Expecting all signals to win — no pattern is perfect, so risk control is key.
By being aware of these mistakes, you can improve your trading discipline.
Morning Star vs Evening Star — Key Differences
- The Morning Star is a bullish reversal pattern at the bottom of a downtrend.
- The Evening Star Candlestick Pattern is its opposite: it is a bearish reversal pattern that appears at the top of an uptrend.
- Structure is similar (three candles: large body → small body → large body), but direction flips (bullish for Morning Star, bearish for Evening Star).
Understanding this difference helps avoid confusing the two and applying the wrong trade direction.
FAQs
Is Morning Star a strong bullish signal?
Yes — the Morning Star pattern is considered a bullish reversal signal. It shows the market may be shifting from a decline to an up-move.
However, “strong” depends on context: one must check trend, volume, support zones, and confirmation.
Can Morning Star work in intraday trading?
Yes — it can work on intraday timeframes (e.g., 1H, 4H) but reliability tends to be lower because of more market noise. It’s more effective on higher timeframes like daily or weekly.
Which timeframe gives highest accuracy?
Generally, daily and weekly timeframes tend to give higher accuracy for reversal patterns like the Morning Star. These timeframes reflect more market participants and less noise.
Is Morning Star valid without volume confirmation?
It may still be valid, but volume confirmation strengthens the signal. A pattern forming with low volume is more prone to failing.
Does Morning Star work in crypto & forex?
Yes — the Morning Star pattern is applicable in various asset classes including stocks, forex, crypto, commodities. The logic (bearish momentum → indecision → bullish momentum) holds across markets.


